Scratching an itch…
When I was in middle school, I became very interested in math, especially recreational math. Magic squares (squares of numbers where every row and column add up to the same number) were an early introduction to fun math, as well as to connections with art: Albrecht Dürer famously included a magic square in his engraving Melencolia. Here’s a detail showing the magic square (the magic number is 34). Dürer cleverly designed the magic square to include the date of painting (1514) in the middle two cells in the bottom row.

Source: Wikipedia
In high school I started reading the “Mathematical Games” column in Scientific American by Martin Gardner. They were often beyond me, but they were also my introduction to the art and math of M.C. Escher.
One of the things I would do for my own amusement (the category for this post, even though really this whole blog is for my own amusement) was make up equations to solve (I know, I know, even back then I needed to get out more). For example, we can take the letters of the word square and use their positions in the English alphabet (a is 1, b is 2, etc.) to form these two equations (among many others, of course). The solution is at the bottom, but don’t peek before you solve the system yourself!
19x + 17y = 21
x + 18y = 5
At some point, programming replaced plain math as a source of recreation, probably since it allowed me to do so many more things, including art. However, I haven’t given up on quirky math things. Recently I noticed this pattern:
23 < 32
24 = 42
25 > 52
-------
34 > 43
35 > 53
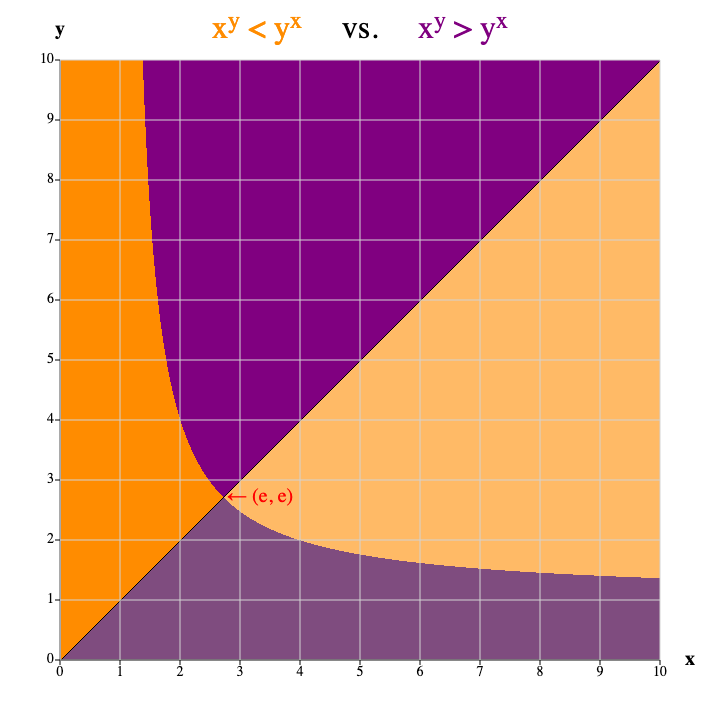
So then I wondered, if x < y, when is xy < yx? The only example in the table above is when x=2 and y=3. Unlike those simple equations above, this question is too tricky for me to solve, but if you want to see the solution to the slightly simpler equation of xy = yx, you can find it (impressively) here. But, I can write a program to calculate xy and yx, compare them, and then color points according to whether xy < yx (orange), xy > yx (purple) or xy = yx (black). Here’s the result (the points where x < y are above the diagonal line):

There are actually 2 curves that come out: the diagonal line for x = y (lines are curves in math — go figure). The other is the more interesting one that looks sort of like an inverse exponential curve. A fun surprise for me was to find that the intersection of the two lines is (apparently, though I haven’t verified it), the point (e,e), where e is Euler’s number, the base of natural logarithms.
It’s oddly satisfying (like scratching an itch) to see that graph, to have figured out the answer to this trivial question, maybe even more so than solving arbitrary (but not random) systems of equations.
Solution to the system of equations
x = 293/325
y = 74/325
I have to admit that solving that system of equations now was not as much fun as my teenage self used to have …
Technical note
I created the graph using Vanilla Javascript (in other words, just plain Javascript, no libraries) as an exercise, just the way solving equations was an exercise. However I did my initial explorations in R using the ggplot2 library, which is where I estimated the intersection of the 2 curves.