The devil is in the details …
In the main post I deliberately glossed over some aspects of creating arbitrary numbers from a photograph. Here I’ll go into some of those aspects, starting with more general ones, and finishing with a truly technical aspect.
A couple small points
In scanning the photo (and coloring the grid), I follow the typical order of left-to-right, top-down. However, there’s no necessary reason to scan/color in that order. We might refer to the different orders of writing systems, as in the shape preserving encodings posts, and scan top-down and/or right-to-left, or even boustrophedon (one of my favorite words!). Any of those regular orders, however, would not make a qualitative difference in the arbitrary numbers.
As for brightness, I actually use luminance not brightness, since it is related more to our vision, by weighting red, green, and blue roughly in proportion to the cones in our eyes that our most sensitive to those colors. In terms of generating arbitrary numbers, though, there is nothing special about luminance. You can use any color property (and I have, as we’ll see in the artistic application), like hue, or just one of the red/green/blue components, etc.
The last small point is that resizing a photograph changes its properties for making arbitrary numbers. Thus the small version shown in the post would not produce the images in the post, which were produced using the full-sized original. The reason why there is a difference (in addition to the sheer number of pixels) is that resizing algorithms almost always adjust the colors to compensate for removing pixels (when shrinking) or adding pixels (when enlarging) to make the result seem close to the original.
Arbitrary numbers are neither uniform nor independent
We saw in the main post that arbitrary numbers had a different distribution for boolean values (true/false, heads/tails, etc). In particular, we got 69% and 79% “heads” instead of the approximately 50% we would expect. We can extend the arbitrary numbers to integers and compare the distribution of a typical set of arbitrary integers with a set of random integers.
There are two main properties that random number generators are supposed to have. The first is that the numbers should be uniformly distributed. The second is that successive random numbers should be independent. Here we’ll see that arbitrary numbers are neither uniformly distributed nor independent.
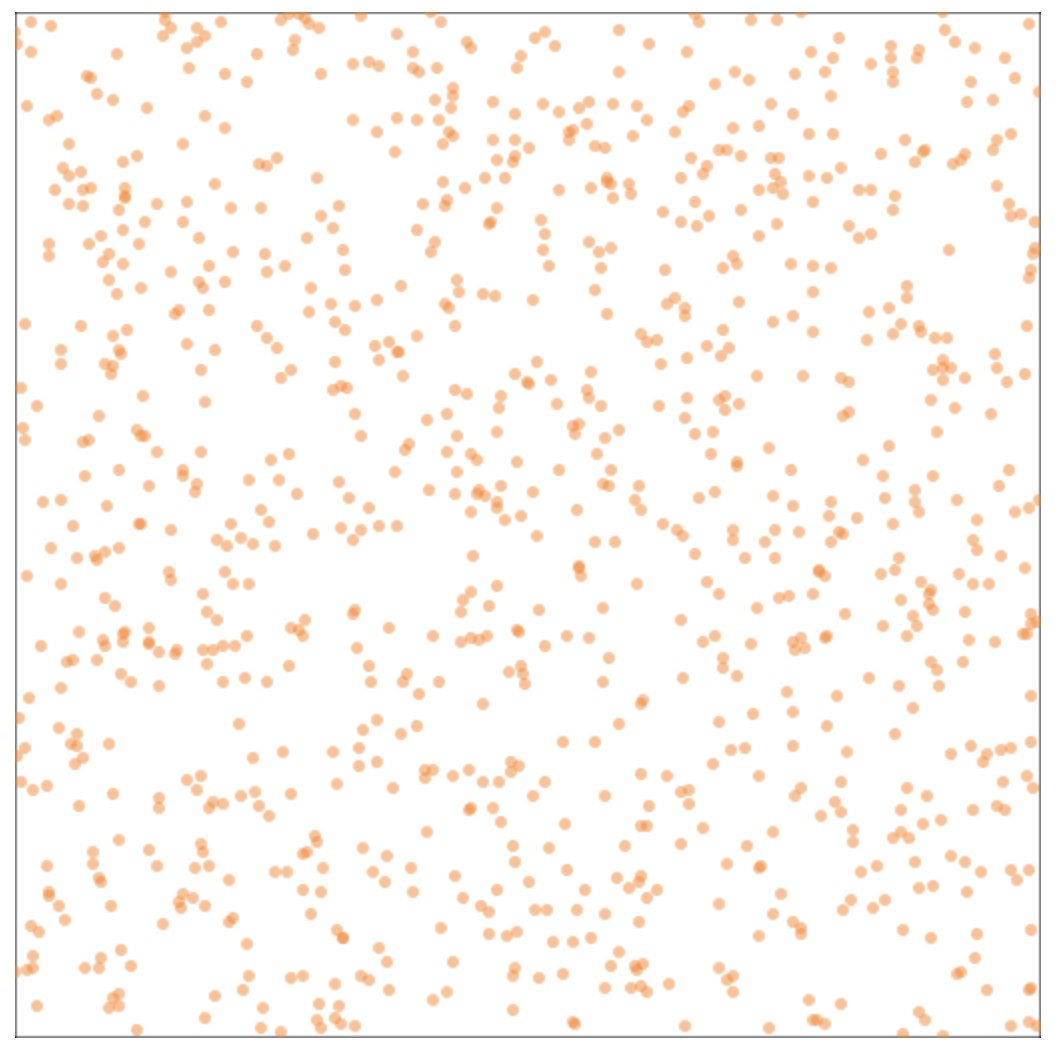
To test uniformity, we generate a large number of integers and count how many of each we get. If the integers are uniformly distributed, the counts should be roughly equal. Here are the results for 1,000,000 integers in the range 0-49 (random first, then arbitrary). As we should expect, the arbitrary integers are not uniformly distributed.
Distribution of 1,000,000 Random Integers

Distribution of 1,000,000 Arbitrary Integers

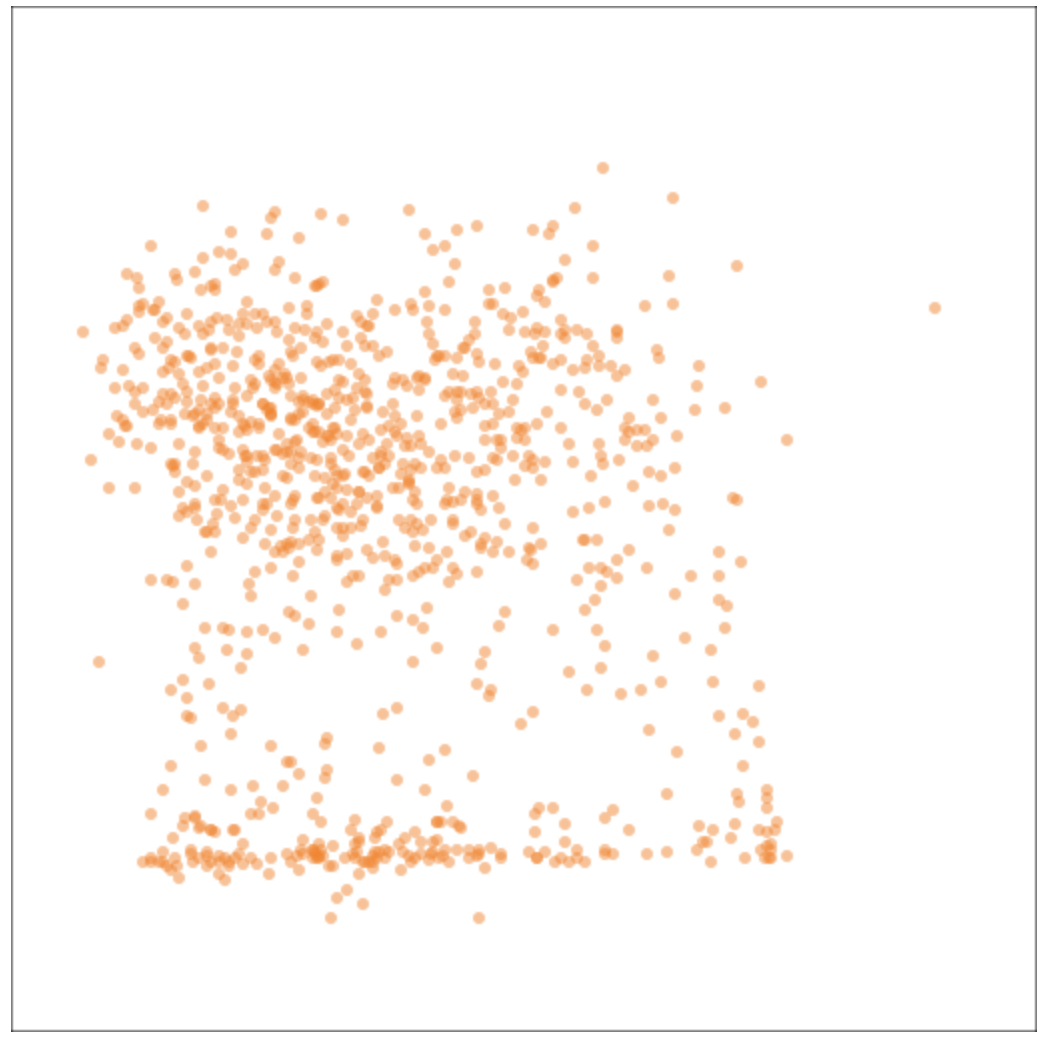
A type of visualization used to look for non-independence of random numbers is the pair plot. We take 2 successive numbers and use them as the x and y coordinates of a point. If the successive numbers are independent, then the points will be distributed relatively evenly throughout the space. If the successive numbers are not independent, then the points will clump together leaving gaps in other places. Here’s a comparison (again, random first, then arbitrary). As we expect, the random pairs are distributed throughout the square, while the arbitrary pairs are limited to the central area, with a slight concentration along the bottom of the central area, leaving the borders empty.
Pair plot of 1,000 random pairs of integers
Pair plot of 1,000 arbitrary pairs of integers (using 5,308,417 as the sampling frequency)
While these two visualizations (of integer distribution and of pair plots) are not proofs that the arbitrary numbers are not uniformly distributed nor independent, they are strongly suggestive, enough that I don’t think further tests are really necessary. But feel free.
Issues with image decoding
Briefly, different browsers (and different programming libraries) decode (“read”) image files differently, so that the pixels we get in Safari (on the Mac) may be different from the pixels we get in Firefox or Google, and may be different from what we get using programming languages. For a conceptually based project such as this one making arbitrary numbers from photographs, those differences are quite disturbing.
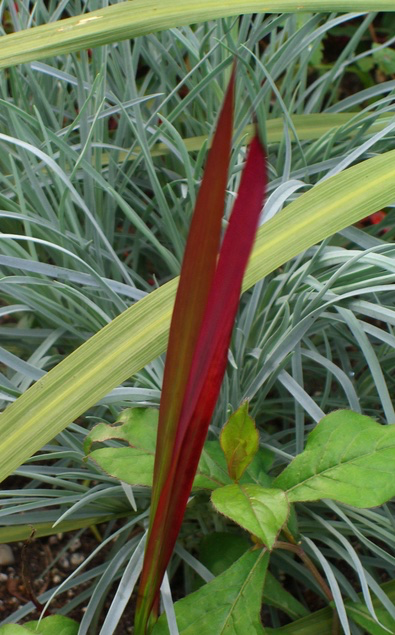
I did some tests, comparing the first 10 pixels (in the normal order — see above) of two versions of a different photograph: a JPEG, and a PNG made from that JPEG. (I used a different photo here because I forgot which one I used for the first post and I didn’t feel like redoing the comparison.) Here are the two test images, in case you want to try things for yourself.
JPEG

Leaves, California © 2003 Chris Culy
PNG
Leaves, California © 2003 Chris Culy
I compared 3 browsers on my Mac: Safari 14.0, Firefox 81.0.2, and Chrome 86.0.4240.111. I also compared the Python library Pillow and the R library ImageR, as well as the MacOS image processing program Pixelmator Pro 1.8. Here are the results for those first 10 pixels, with identical pixel values highlighted.
![]()
The main thing to see is that the different programs report different colors for those first 10 pixels, and the same program may report different values between the JPEG and the PNG versions (Firefox, Chrome, ImageR).
Safari and Pixelmator Pro are identical — I’m guessing that they use the same MacOS image library for reading the files. Python’s Pillow treats the JPEG and the PNG identically, but differently from Safari/Pixelmator. R’s ImageR has a split, with the PNG being like Safari/Pixelmator and the JPEG like Python’s Pillow. Firefox and Chrome also have a split, with Chrome’s PNG begin like Safari/Pixelmator, but their JPEGs are very different from each other and the others.
Why are they different? I don’t really know. The differences in the JPEG versions in Firefox and Chrome and Safari/Pixelmator are at most one per red/green/blue so that they could be rounding differences, but that is still odd. The PNG differences among those 3 are much greater.
More generally, there are a couple other things that could be going on. The photos have an embedded sRGB color profile, so it’s possible that the different underlying libraries treat the color profile differently (they shouldn’t) or ignore it (possibly, but not very nice if they do). Another possibility is that the different libraries are dealing with the gamma correction differently (but they shouldn’t, I don’t think, if they are using the sRGB profile). As to why JPEGs and PNGs are different within some libraries— maybe different decisions in the JPEG decoder were made without coordinating with the PNG decoder. Not ideal from my perspective.
Obviously, there’s lots I don’t understand here, since I assumed that reading the same file in different programs would report the same pixel color values. How naive of me …